Thursday 7 October 2010

Sometimes we get it right – but we don’t make it easy

At the cost of sounding like a health information geek, I have to say it’s been fascinating to get to know the Sixth National Adult Cardiac Surgical Database Report 2008.
What makes it so interesting is that it’s clearly designed to deliver to clinicians exactly the information they need to be able to compare their own performance in cardiac surgery against national benchmarks. The report, one of several produced by e-Dendrite Clinical Systems Ltd on behalf of different clinical associations and based on one of the many data registries they hold, shows indicators defined by clinicians and calculated to their specifications.

This is diametrically opposed to the approach adopted by the national programmes that have dominated health informatics in England over the last ten years, apparently about to vanish without trace and without mourners. They based themselves on datasets that used at one time to be called ‘minimum’. The word has been dropped but it still applies: these dataset represent the least amount of data that a hospital can sensibly be expected to collect without putting itself to any particular trouble. Essentially, this means an extract from a hospital PAS alone, with none of the work on linkage between different data sources that I’ve discussed before.

The indicators that can be produced from such minimal information are necessarily limited. Usually we can get little more than length of stay, readmissions and in-hospital mortality. We’ve already seen how misleading the latter can be when I talked about the lurid headlines generated over Mid Staffordshire Trust.

The contrast with the Cardiac Surgery Database could hardly be more striking.

Clinicians have defined what data they need, and have made sure that they see just that. If it’s not contained in an existing hospital system, they collect it specifically. The base data collection form shown in the report covers six pages. There are several other multi-page forms for specific procedures.

An automatic feed from Patient Administration System can provide some of the patient demographic data, but apparently in most contributing hospitals, the feed is minimal. All the other data has to be entered by hand. It must be massively labour-intensive, but clinicians ensure it’s carried out because they know the results are going to be useful to them.

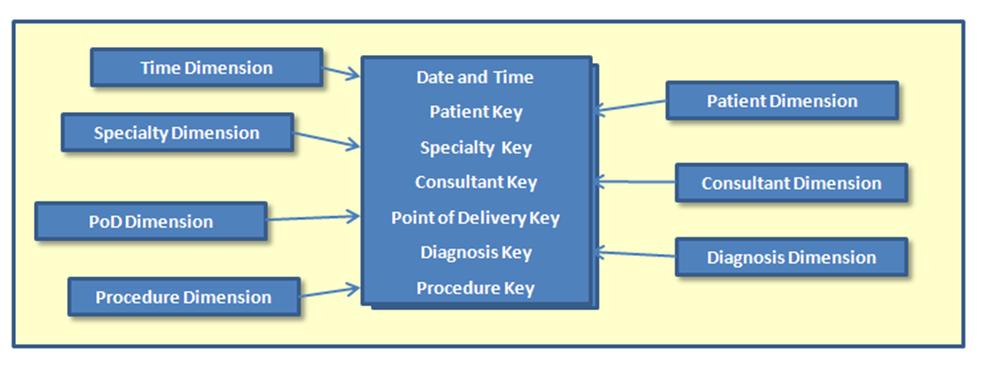
An example of the kind of analysis they get is provided by the graph below, showing survival rates after combined aortic and mitral valve surgery, up to five years (or, more precisely, 1825 days) following the operation. What’s most striking about this indicator is that it requires just the kind of data linkage that we ought to be carrying out routinely, and this case with records from outside the hospitals: patient details are being linked to mortality figures from the Office of National Statistics, meaning that we’re looking at deaths long after discharge and not just the highly limited values for in-hospital deaths that were used in the press coverage about Mid Staffordshire.


Less obvious but at least as significant is the fact that the figures have been adjusted for risk – and not using some general rule for all patients, but on a series of risk factors relevant to cardiac surgery: smoking, history of diabetes, history of hypertension, history of renal disease, to mention just a few.

Looking at the list of data collected, it’s clear that more automatic support could be provided. For instance, it should be possible to provide information about previous cardiac interventions or investigations, at least for work carried out in the hospital. Obviously, this would depend on the hospital collecting the data correctly, but a failure in data collection is surely something to be fixed rather than an excuse for not providing the information needed.

It is unlikely that the hospital could provide the information if the intervention took place at another Trust, so cardiac surgery staff would still have to ask the question and might have to input some of the data themselves. Automatically providing whatever data is available would, however, still represent a significant saving of effort.

The converse would also be invaluable: if cardiac surgery staff are adding further data, surely it should be uploaded into the central hospital database or data warehouse? That would make it available for other local reporting. It seems wasteful to collect the data for one purpose and not make it available for others.

Of course, all this depends on linkage between data records. It’s becoming a recurring refrain in these posts: linkage is something that should be a key task for all Trust information departments. What we have here is another powerful reason why it needs to be done systematically.

And while we’re thinking about data linkages, let’s keep reminding ourselves that this Report uses links to ONS mortality data. Doing that for hospital records generally would provide far more useful morality indicators. So what’s stopping us doing it?


Wednesday 29 September 2010

What's the White Paper going to mean for Healthcare Information?

The need for better information is a theme at the core of the reforms announced in the health White Paper.

The preamble to the document states some of the principles on which the government is basing its approach. For instance, ‘patients will have access to the information they want, to make choices about their care. They will have increased control over their own care records.’ Empowering patients, a core value of the White Paper, will require far greater access to information than in the past.

Another view of the same principle appears in the declaration that ‘a culture of open information, active responsibility and challenge will ensure that patient safety is put above all else, and that failings such as those in Mid-Staffordshire cannot go undetected.’

Poor, much-maligned Mid-Staffs seems destined to be the icon for poor hospital performance for a while longer. This is the case even though it’s not obvious that it suffered from much more than resource starvation as a result of a headlong rush for Foundation Trust status. Indeed, it’s not even clear that it performed substantially less well than other Trusts: even Dr Foster whose figures precipitated the original scandal, classified it ninth in the country within the year, using broadly similar indicators.

Still, the point here is that we’re again talking about information openness with patient considerations at the centre. For our purposes, all we need to take out of the Mid-Staffs experience is the lesson that getting information right is at least as important as making it accessible.

We also read that ‘the NHS will be held to account against clinically credible and evidence-based outcome measures, not process targets.’ The focus on outcomes will be a major theme for anyone involved in healthcare information in the coming years.

All this needs to be set against the background of the increasing shift towards GP-led commissioning and the unravelling of the National Programme for IT.

It may be a little premature to assume that the Commissioning Consortia will get off the ground any time soon. It feels to me as though a lot more money will have to be found to cover management costs. The Tory Andrew Lansley is unlikely to like the idea that he’s following in the footsteps of Nye Bevan, Socialist founder of the NHS, but he may find himself having to deal with doctors as Bevan did, by ‘stuffing their mouths with gold.’

Two aspects are going to dominate a reformed commissioning process. The first is that GPs are going to be interested in buying packages of care – treat this diabetic, remove that cataract, manage this depression – rather than just elements of a package – carry out this test, administer that medication, provide this therapy . So it’s no good saying ‘we provided another outpatient attendance’ if the protocol for the condition doesn’t allow for another attendance: the consortium will challenge the need to pay for the additional care. An approach based on care packages means analysis of pathways, not events.

The second is that outcomes are going to be crucial. So pathways have to be taken to their conclusion, which means they can’t be limited to what happened before discharge from hospital.

It seems to me that this is going to mean moving beyond current measures – readmissions or in-hospital mortality – to look at outcome indicators that tell us far more: patient reported outcome measures, through questionnaires about health status after treatment, and mortality within beyond discharge, through linking patient records with Office of National Statistics data.

Only with these measures will it be possible to see if care is delivering real benefit and, therefore, real value for money.

What about the demise of the National Programme? It always struck me as odd that a drive for efficiency and cost control should have set out to create local monopolies for the supply of software. How could that maintain the kind of choice that we wanted to offer patients, and therefore exercise the downward pressure on price and upward pressure on quality that competition is supposed to generate?

There also seemed to be a fundamental misconception in the idea that it was crucial to get all your software from a single source. One aim, of course, was to ensure that all systems were fully integrated. But if we’re building pathways, we do it with data from different sources linked in some intelligent way. That can be done by imposing on a range of suppliers the obligation to produce the necessary data in the appropriate form. That doesn’t require monopoly but accreditation.

The end of the National Programme, at least as far as local software supply is concerned, has to be welcomed. But, taken with the new pressures for different kinds of data, it will lead to significant pressure on healthcare information professionals, above all to learn to link data across sources and even beyond the limits of a hospital.

A challenge. But, I would say, an exciting one.

Thursday 23 September 2010

Showing the pathway forward

When it comes to building pathways out of healthcare event data, it’s crucial not to be put off by the apparent scale of the task. In fact, it's important to realise that a great deal can be done even with relatively limited data. Equally, we have to bear in mind that a key to achieving success is making sure that the results are well presented, so that users can understand them and get real benefit from them. 

Since that means good reporting, and therefore a breach with the practice I described in my last piece, this post is going to be rich in illustrations. They were most kindly supplied by Ardentia Ltd (and in the interests of transparency, let me say that I worked at the company myself for four years). The examples I've included are details of screenshots from Ardentia's Pathway Analytics application, based on sample data from a real hospital. At the time, the hospital wasn't yet in a position to link in departmental data, for areas such as laboratory, radiology and pharmacy, so the examples are based on Patient Administration System (PAS) data only. My point is that even working with so apparently little can provide some strikingly useful results.  

The screenshots are concerned with Caesarean sections for women aged 19 or over. The hospital has defined a protocol specifying that cases should be managed through an ante-partum examination during an outpatient visit, followed by a single inpatient stay. Drawing on Map of Medicine guidelines, it suggests that a Caesarean should only be carried out for patients who have one of the following conditions: 
  • Gestational diabetes
  • Complications from high blood pressure
  • An exceptionally large baby
  • Baby in breech presentation
  • Placenta praevia
The protocol can be shown diagrammatically as two linked boxes with details of the associated conditions or procedures. For example, the second box in the diagram shows the single live birth associated with the section, and then five conditions one of which should be present to justify the procedure. 
Detail of an Ardentia Pathway Analytics screen with a protocol for Caesarean Sections
Next we compare real pathways to the protocol. At top level, we look only at the PAS events (OPA is an outpatient attendance and APC is an inpatient stay):
Part of the screen comparing actual pathways to the protocol (the full screen contains several more lines).
Note the low-lighted line, second from the top, that corresponds to the protocol shape.
The first striking feature of the comparison is that only a minority (14%) of the cases corresponds to the protocol at all. 65% of the cases have a single admitted patient care event without an outpatient attendance. This should lead to a discussion of whether the protocol is appropriate and whether this kind of case could be legitimately handled with a single inpatient stay and no prior outpatient attendance (perhaps as a an alternative protocol structure).
Another feature is the number of cases involving a second or subsequent inpatient stay. Now there’s a health warning to be issued here: these screens are from a prototype product and the analysis is based on episodes, not spells, so we can’t be certain the second admitted patient care event is an actual second stay – it might be a second episode in the same stay. If, however, an enhanced version of the product showed there really were subsequent stays, we’d have to ask whether what we are seeing here are readmissions. In which case, is something failing during the first stay?
We can drill further into the information behind these first views. For instance, we could look more closely at the eight cases which apparently involved an outpatient attendance followed by two inpatient stays:
Three pathway shapes or types followed by cases that apparently
involved an additional inpatient stay
 The first two lines show instances where the delivery took place in the first inpatient stay (the box for the first stay is associated with a circile containing the value '1', corresponding to the entry in the protocol for a single live birth). In seven of these cases, the patient needed further inpatient treatment after the Caesarean. The last line shows something rather different: the patient was admitted but not delivered and then apparently had to be brought back in for the delivery.
Note that the middle line shows that just two cases out of the total of eight are associated with a diagnosis specified by the protocol as a justification for a Caesarean: they are linked with condition 5, breech presentation. The fact that no such information is recorded for the other six suggests either that Caesarean sections have been carried out for cases not justified by the protocol, or that key data is not being recorded. Either way, further investigation seems necessary.
We can also look in more detail still at individual cases.

Clinical details for a specific event
The example shows a case that has followed the protocol: an ante-partum examination was carried out on 5 May and the patient was admitted on the same day, with the Caesarean section taking place on 8 May. The ticked box in the greyed-out diagram shows that a condition justifying the caesarean has been recorded (placenta praevia). This is confirmed by the highlighted box of detailed information (note that the consultant's code has been removed for confidentiality reasons).

The simple examples here show that pathway analysis provides a real narrative of what happens during the delivery of healthcare to a patient. On the one hand, it can answer certain questions, such as why a Caesarean was carried out at all, and on the other it can suggest further questions that need investigation: what went wrong with this case? why was the procedure carried out in the first place? was there a significant deviation from the protocol?

If we can do that much with nothing more than simple PAS data, imagine how powerful we could make this kind of analysis if we included information from other sources too...

Monday 20 September 2010

Caution: software development under way

Software development work has admirably high professional standards. Unfortunately, developers find it a lot easier to state them than to stick to them.

If your development team is one of those that lives up to the most exacting standards, this blog post isn’t for you. If, on the other hand, an IT department or software supplier near you is falling short of the levels of professionalism you expect, I hope his overview may give you some pointers as to why.

Estimates, guesstimates

One of the extraordinary characteristics of developers is their ability to estimate the likely duration of a job. It’s astonishing how they can listen for twenty minutes to your description of what you want a piece of software to do, and then tell you exactly how long it’ll take to develop.

Afterwards you may want to get an independent and possibly more reliable estimate, say by slaughtering a chicken and consulting its entrails.

At any rate, multiply the estimate by at least three. This is because the developer will have left a number of factors out of account.
  • He – and it usually is a ‘he’ – already has three projects on the go. He’s told you he’s fiendishly busy, but that won’t stop him estimating for the new job as though he had nothing else on. Why? Because a new project is always more interesting than one that’s already under way.
  • He’ll make no allowance for interruptions, though he knows that his last three releases were so bug-ridden that he’s spending half of every day dealing with support calls.
  • He’ll make no allowance for anything going wrong. I suffered from this problem in spades. I remember very clearly the one project I worked on which came in less than 10% over schedule. It’s the only one I remember when I’m estimating. All the others, which came in horrendous overruns, are expunged from my mind.
  • He only thinks of his own time. For instance, he hasn’t allowed for documentation. Developers are part of a superior breed that lives by mystical communication with each other. Writing things down is like preparing a pre-nuptial agreement: it destroys all the romance. As for QA, well, yes, of course there should be some, but only to confirm that the software is bug-free. A few days at the end of the project. You object that there may be some feedback, as QA finds errors that need to be fixed. Well, yes, add a few days for that too, but believe me, it really isn’t going to hold up the project.. The Red Queen in Lewis Carroll’s Through the Looking Glass claimed ‘sometimes I've believed as many as six impossible things before breakfast.’ If you want to emulate her, start with ‘you can get good software without extensive QA.’ 
  • He hasn’t actually seen a specification yet. That one deserves a section to itself.
Specifications – who needs one?

Once you’ve told the developer what you need from the new system, he just wants to get on with it. He doesn’t want to waste time writing requirements down. He wants to get on with cutting code.

Perhaps I should have written ‘Code’, with a capital ‘C’, since it has the status of near-sacred text. For those who don’t know it, it’s made up of large blocks of completely opaque programming language. Some unorthodox developers believe in including the occasional line of natural English, so-called comment lines, with the aim of explaining to someone who might come along later just what the code was intended to do. To purists, these lines just interrupt the natural flow of the Code. The next guy will be another member of the sacred band and will work out what the Code was intended to do, just by reading it and applying his mystic intuition. Comment lines are just boring, like specifications.

It’s true that specifications can be deadly. I recently saw a 35-page text covering work that we actually carried out in less than five days. The spec contained at least one page marked ‘This page intentionally left blank.’ Whenever I see one of those I want to scribble across it ‘why wasn’t this blank page intentionally left out?’

That kind of thing gives specifications a bad name, but something tighter and more to the point can be really useful. It can at least ensure that we understand the same thing by the words we use.

Once I came across a system which assumed that ‘Non-Elective’ meant the same as ‘Emergency’. Terribly embarrassing when you have to explain to a Trust why its emergency work has shot up while its maternity work has fallen to zero along with the tertiary referrals it used to receive.

Of course, if you’re working with people who just never need anything like that made clear to them, you may well be able to get away without a proper spec. One word of warning though: it’s really difficult to see how you can test software to see if it’s behaving properly, if you haven’t previously defined what it should be doing in the first place.

It’s about the reporting, dummy.

Ever since Neanderthal times man has been expressing himself by means of graphics. So why in the twenty-first century are IT professionals finding it so difficult to understand the need to do the same?

Most users of healthcare information think its aim should be to help take better decisions about care delivery. So they might want to see a range of indicators all included in a single dashboard-type report. They may want to be able to drill up and down, say from a whole functional area within a hospital down to individual clinical teams to groups of patients with similar diagnoses. They may want to see values for the whole year or for a single months or, indeed, for trends across several months. They may ultimately want to get down to the level of the individual patient records behind the general indicator values.

Now many IT people will simply yawn at all this. Have you ever come across the term ‘ETL’? It means extract, transfer and load. The most exciting for an IT person is ‘Extract’. This means he’s looking at someone else’s system. This is a challenge, because the probability is that the teams who built that system didn’t bother with any comment lines or documentation – they’re kindred spirits, in fact. So it’s a battle of wits. Our man is hunting among tables with names like ‘37A’ or ‘PAT4201’, trying to identify the different bits of information to build up the records he’s been asked to load. And it’s a long-term source of innocent fun: system suppliers are quite likely to change the structure of their databases without warning, so that our developer can go through the whole process again every few months.

Next comes Transfer. Well, that’s a bit less absorbing though it can still be amusing. Your tables, for instance, might hold dates of birth in the form ‘19630622’ for 22 June 1963. The system you’re reading from might hold them in the form ‘22061963’. You can fill some idle hours quite productively writing the transfer routines mapping one format to the other.

Finally, there’s Load. Well, OK. Yes, it has to be done, but it’s not half as exciting. Get the data in, make sure that it’s more or less error-free. A bit fiddly, but there you go. Once it’s finished, your work is done.

Have you noticed the omission? We’ve done E, T and L. There’s been no mention of ‘R’ – Retrieval. What matters for IT is getting the data in and storing it securely. Making it available for someone else to use? Come on, that’s child’s play once the data’s been loaded into a database. It’s someone else’s department altogether.

Sadly, that’s not a department that is always as well staffed as it might be. That’s why hospitals are awash with data but short on information. That’s why we’ve spent billions on information systems with so little to show for it. That’s why clinical departments that want to assess their work build their own separate systems, creating new silos of data.

Unfortunately, investment isn’t as easy any more, and we certainly can’t keep making it without the real promise of a return. It’s great to see developers having fun, of course, but wouldn’t be even more fun to deliver systems that really worked and that healthcare managers really wanted to use? Systems that genuinely delivered information for management?

Sound utopian? Maybe it is.

But since it’s pretty much the minimal demand any user should be making of an information system worthy of the name, maybe it’s time we started insisting on it a bit more forcefully.

Wednesday 25 August 2010

Semmelweis: mortality and benchmarking

Semmelweis in 1860
It concerns me that in my previous post I may have given the impression that I thought that mortality could never be a good indicator of care quality (or, strictly, poor care quality). This is by no means the case: what I’m saying is that mortality figures have to be handled with prudence and there are many areas of care where they are not helpful, if only because mortality is so low.

One of those areas, in the developed world at least, is maternity services. I say in the developed world because in 2008, the maternal mortality rate in the UK was 8.2 per 100,000; in Ghana it was 409 and in Afghanistan it was 1575, so in the latter two countries it is certainly a useful indicator, indeed an indictment of how little we have achieved in improving healthcare across the world.

It used to be a significant indicator in Europe too. In 1846, for example, Professor Ignaz Semmelweis was working in a Viennese hospital in which two clinics provided free maternity services in return for the patient accepting that they would be used for training doctors and midwives. Semmelweis was appalled to discover that there were massively different rates of death from puerperal fever, or childbed fever as it was called, in the two clinics. As the table below shows, the figures over six years showed mortality of just under 10% in the first clinic and just under 4% in the second.

Semmelweis's findings for the two Clinics. Source: Wikipedia


In a fascinating early example of benchmarking, Semmelweis carried out a detailed study of both clinics gradually eliminating any factor that could explain the difference. One possible cause he was able to exclude early on was overcrowding: women were clamouring to get into the second clinic rather than the first, for obvious reasons, so it had a great many more patients.

Eventually, the only difference he could identify was that the first clinic was used for the training of doctors and the second for the training of midwives. And what was the difference? The medical students also took part in dissection classes, working on putrefying dead bodies, and then attended the women in labour without washing their hands. Semmelweis was able to show that with thorough handwashing using a sterilising solution it was possible to get childbed fever deaths down to under 1%.

Unfortunately, his findings weren’t received with cries of joy. On the contrary, since he seemed to be suggesting that the doctors were causing the deaths, he met considerable resistance. Semmelweis died at the age of 47 in a lunatic asylum (though this may not have been related to the reception of his work). It took Louis Pasteur's research and the adoption of the theory of disease transmission by germs for Semmelweis’s recommendations to win widespread acceptance.

This is a striking illustration of the principle that it isn’t enough to demonstrate the existence of a phenomenon and that you have to have a plausible mechanism to propose for it too. Semmelweis had shown the germ-borne spread of disease, but he hadn’t proposed the germ mechanism to explain how it happened.

Still, Semmelweis’s works remains a brilliant use of mortality as an indicator and the use of benchmarking to achieve a breakthrough in the improvement of healthcare. An excellent example of the brilliant use of healthcare information.

Thursday 19 August 2010

Indicators are only useful if they’re useful indicators

We’ve seen that pulling healthcare data from disparate sources, linking it via the patient and building it into pathways of care are the essential first steps in providing useful information for healthcare management. They allow us to analyse what was done to treat a patient, how it was done and when it was done. Paradoxically, however, we have ignored the most fundamental question of all: why did we do it in the first place?

The goal of healthcare is to leave a patient in better health at the end than at the start of the process. What we really need is an idea of what the outcome of care has been.

The reason why we tend to sidestep this issue is that we have so few good indicators of outcome.

In this post we’re going to look at the difficulties of measuring outcome. In another we'll review the intelligent use that is being made of existing outcome measures, despite those difficulties, and at initiatives to collect new indicators.

The first thing to say about most existing indicators is that they are at best proxies for outcomes rather than direct measures of health gain. They're also usually negative, in that they represent things that one would want to avoid, such as mortality or readmissions.

Calculating them is also fraught with problems. Readmissions, for example, tend to be defined as an emergency admission within a certain time after a discharge from a previous stay. The obvious problem is that a patient who had a perfectly successful hernia repair, say, and then is admitted following a road traffic accident a week later will be counted as a readmission unless someone specifically excludes the case from the count.

At first sight, it might seem that we should be able to guard against counting this kind of false positive by insisting that the readmission should be to the same speciality as the original stay, or that it should have the same primary diagnosis. But if the second admission had been as a result of a wound infection, the specialty probably wouldn’t have been the same (it might have been General Surgery for the hernia repair and General Medicine for the treatment of the infection). The diagnoses would certainly have been different. However, this would certainly have been a genuine readmission, and excluding this kind of case would massively understate the total.

It’s hard to think of any satisfactory way of excluding false positives by some kind of automatic filter which wouldn’t exclude real readmissions.

Another serious objection to the use of readmission as an indicator is that in general hospitals don’t know about readmissions to another hospital. This will depress the readmission count, possibly by quite a substantial number.

Things are just as bad when it comes to mortality. Raw figures can be deeply misleading. The most obvious reason is that clinicians who handle the most difficult cases, precisely because of the quality of their work, may well have a higher mortality rate than others. Some years ago, I worked with a group of clinicians who had an apparently high death rate for balloon angioplasty. As soon as we adjusted for risk of chronic renal failure (by taking haematocrite values into account), it was clear they were performing well. It was because they were taking a high proportion of patients at serious risk of renal failure that the raw mortality figures were high.

This highlights a point about risk adjustment. Most comparative studies of mortality do adjust for risk, but usually based on age, sex and deprivation. This assumes that mortality is affected by those three factors in the same way everywhere, and there's no really good evidence that they really do. More important still, as the balloon angioplasty case shows, we really need to adjust for risk differently depending on the area of healthcare we’re analysing.

This is clear in Obstetrics, for instance. Thankfully, in the developed world at least, death in maternity services is rare these days, so mortality is no longer a useful indicator. On the other hand, the rate of episiotomies, caesarean or perineal tears are all relevant indicators. They need to be adjusted for the specific risk factors that are known to matter in Obstetrics, such as the height and weight of the mother, whether or not she smokes, and so on.

Mental Health is another area where mortality is not a helpful indicator. Equally, readmission has to be handled in a different way, since the concept of an emergency admission doesn't apply to Mental Health, and generally we would be interested in a longer gap between discharge and readmission than in Acute care.

Readmission rates and mortality are indicators that can highlight an underlying problem that deserves investigation. They have, however, to be handled with care and they are only really useful in a limited number of areas. If we want a more comprehensive view of outcome quality, we are going to have to come up with new measures, which is what we’ll consider when we look at this subject next.

Wednesday 11 August 2010

It’s the patient level that counts

What happens in healthcare happens to patients. Not to wards or theatre or specialties, far less HRGs, DRGs or Clusters. Ultimately, the only way to understand healthcare is by analysing it at the level of the individual patient.

Much of the information we work with is already at that level or even below. An inpatient stay or an outpatient attendance is specific to a particular event for an individual patient. We need to be able to move up a level and link such event records into care pathways.

Much information, on the other hand, is held at a level far above that of the patient. Financial information from a ledger, for example, tells us how much we spent on medical staff generally but not on a specific patient. Most pharmacy systems can tell us what drugs were used and how much they cost but usually can’t tell us is which medications were dispensed for which patients.

On the cost side, one answer to this kind of problem is to build relatively sophisticated systems to apportion values – i.e. to share them out across patient records in as smart a way as possible. For example, an effective Patient Level Costing system uses weights reflecting likely resource usage to assign a higher share of certain costs to some patients than to others. The effect is to take high-level information down to patient level.

In some areas, that's the only approach that will ever work. For nursing costs, one can imagine a situation where patients have bar-coded wrist bands that nurses read with wands, giving an an accurate view of the time taken over each patient. But the approach would be fraught with problems:

  • it would be expensive and impose a new task, designed only to collect information without contributing to patient care, on nurses who already have more than enough to do
  • it would be subject to terrible data quality problems. Just think of the picture we’d get if a nurse wanded himself in to a bedside, and then forgot to wand out, which it wouldn't surprise me to see happen with monotonous frequency
  • even if all nurses could be persuaded to use the wands and did so accurately and reliably, it’s not clear that we would get a useful view of nurse time use: after all, when staff are under less pressure, a nurse might take longer over a routine task such as administering drugs, but it would be nonsense to assign the patient a higher cost as a result
For resources like nursing, it seems sensible to share the total figure across all the patients, in proportion to the time they spent on a ward, as though they were incurring a flat fee for nursing care irrespective of how much they actually used. This suggests that apportionment actually gives the most appropriate picture.

But with other kinds of cost, we really ought to be getting the information at patient level directly. We ought to know exactly which prosthesis was used by a patient, how much physiotherapy was delivered, precisely which drugs were administered. If we don’t, then that’s because the systems we’re using aren’t clever enough to provide the information. In that case we need cleverer systems.

For example, pathology systems tend to have excellent, patient-level information already. We just need to link the tests to the appropriate activity records, making intelligent use of information such as the identity of the patient and the recorded dates. This has to be done in a flexible way, of course, to allow for such occurrences as a pathology test carried out some time after the clinic attendance at which it was requested.

Linking in pathology information would immediately make pathway analysis richer. When it comes to costing, we still need an apportionment step, to calculate individual test costs from overall lab figures, but then the calculated value can be directly assigned to the patient record.

The same kind of approach can be applied to diagnostic imaging, the therapies and many other areas. For example, we can calculate a cost for a multi-disciplinary team meeting and then assign that cost to the patient record, as long as the information about the meeting is available in a usable form.

Then, however, there are other areas of work where we should be able to operate this way but generally can’t. Few British hospitals have pharmacy systems that assign medications to individual patients. If they did, and given that the pharmacy knows the price it is being charged for each dose, we could link the prescription to the patient record and assign its actual cost to it. Given that pharmacy is the second biggest area of non-pay cost in most acute hospitals, after theatres, this would be a significant step forward.

The same is true of similar services in other departments, such as blood products.

Getting this kind of information right would greatly enhance our understanding both of care pathways and of patient costs. As I’ve already pointed out, that would be a huge improvement in the capacity of hospitals to meet the challenges ahead.

Saturday 7 August 2010

Navigating the Pathways and Protocols of Care


A major advantage of the pathway view of healthcare is that it allows us to compare the actual of process of treatment with agreed protocols. A protocol represents a consensus view among experts on the most appropriate way of treating a particular condition.

Although such consensus often exists, it’s striking how frequently what actually happens differs substantially from accepted best practice. Sometimes it’s for good reasons associated with the particular case, but often it’s simply a failure to stick to guidelines with the result that care falls short of the highest standards. Oddly, poor care may often be more expensive too, since additional work is needed to correct what could have been done right in the first place. So there’s a double reason for trying to eliminate this kind of variation.

Unfortunately, today’s hospital information systems generally find it difficult to support pathway analysis and comparisons with protocols. This is partly because the information needs to be brought in from multiple sources and then integrated, which may seem dauntingly difficult. However, there is actually a great deal that can be done with relatively simply data. There’s a lot to be said for not being put off by the difficulty of doing a fully comprehensive job, when one can start with something more limited now and add to it later.

Take the example of cataract treatment in a hospital that has decided to follow the guidelines of the NHS version of the Map of Medicine. The Map suggests the preferred procedure is phacemulsification. Routine cases have day surgery with a follow-up phone call within 24 hours and possibly an outpatient review after a week. This allows us to build a pathway for routine cases entirely from PAS data or at worst PAS and other Contacts data.


Map of medicine suggests non-routine cases occur where there is a particular risk of complications, the patient only has one eye or the patient is suffering from dementia or learning difficulties. In these instances, we would expect daily home visits in the first week and certainly an outpatient attendance for review within one to four weeks of discharge.

So here’s a second pathway structure:


Again, information about home visits might be in the PAS or might have to be added. We also need to check on diagnosis information from the PAS for dementia or learning difficults.

The two pathway structures shown above correspond to the two protocols. So now we can compare them with similar pathways built for real patients in the hospital. The aim is to limit the number of cases that we investigate further to only those that differ significantly from the guidelines.

So any cases where the pathway is the same as for routine cases can be ignored.

Any cases where the pathway is the same as for non-routine cases can be ignored as long as there is evidence of dementia or of learning difficulties, or the patient had a single eye or there was a serious risk of complications. It's possible that the last two pieces of information aren't routinely collected, in which case we shall find ourselves investigating some cases that didn't need it until we can start to collect them.

Overall what this approach means is that we can eliminate a lot of cases from examination and concentrate management attention on only those where there may be a real anomaly, and action could lead to an improvement in the future. That has to be a huge step forward over what most hospitals can do today. Yet it involves relatively straightforward work on information systems.

Adding other data could improve the analysis. Information from a theatre system would tell us about, say, how long the operation takes. If patient-level information about medication is available, it can be linked in to check that appropriate drugs are being administered at the right times.

In the meantime though, we would be working with a system that should be relatively easy to implement and can help us make sure patients are being treated both effectively and cost-effectively.

That sounds like a something it would be good to do, given today's pressure to deliver more while costing less.

Most of the information to check on compliance will be in hospital Patient Administration Systems (PAS).

The PAS records procedures so we can check whether phacoemulsification was used or not. In some acute hospitals, the PAS may not record non face-to-face contacts, which would cover the telephone follow-up, but the information is certainly held somewhere and it should not be insuperably difficult to link it with PAS data. All these data items have dates associated with them, so we can apply rules to check that the right actions were taken at the appropriate time.

Sunday 1 August 2010

Lies, damned lies and misused healthcare statistics


If you live in Stafford, as I do, it comes as a great relief to see that the Care Quality Commission (CQC) has decided to lift five of the six restrictions it had placed on the Mid Staffordshire Trust, our local acute hospital, following the scandal there over care quality. It was particularly gratifying to read that mortality rates have fallen and numbers of nurses are up to more sensible levels. It’s obviously good news that a hospital that had been having real problems with quality seems to be well on the way to solving them.
On the other hand, much of the original scandal had missed the fundamental point. Much was made of the finding that between 400 and 1200 more people had died in the hospital than would have been expected. The implication was that poor quality had led to excess deaths, even though there was no way of linking the deaths to care quality defects. Indeed, the Health Care Commission, the predecessor of the CQC, had decided to take action over the quality of care at the Trust, but not because of the mortality figures which it had decided not to publish and was irritated to see leaked.

Now on 28 May, Tim Harford’s Radio 4 programme More or Less examined the use of statistics about Mid-Staffs. David Spiegelhalter, Professor of the Public Understanding of Risk at the University of Cambridge, warned listeners that we need to be careful with the concept of ‘excess deaths’, because it really only means more deaths than the average and ‘half of all hospitals will have excess deaths, half of all hospitals are below average.’

What we need to look out for is exceptionally high values, although even there we have to be careful as there are many reasons why a hospital might be extreme: ‘first of all you’ve just got chance, pure randomness: some years a hospital will be worse than average even if it’s average over a longer period.’

Spiegelhalter also questions the techniques used to make the statistics more relevant, such as risk adjustment. That kind of adjustment aims to take into consideration the extent to which mortality might be affected by factors external to the hospital, such as race, poverty or age. That should give a better way of comparing hospitals, but in reality the procedure is inadequate because ‘there’s always variability between hospitals that isn’t taken into account by this risk adjustment procedure, not least of which is that we assume that factors such as age, ethnicity and deprivation have exactly the same effect in every hospital in the country’, an assumption that we’re not justified in making.

Spiegelhalter’s conclusion? Mortality is ‘a nice piece of statistics and it’s great as a performance indicator, something which might suggest that something needs looking at, but you can’t claim that excess mortality is due to poor quality care.’ Not that such considerations stopped many newspapers making exactly that claim.

Of course, Spiegelhalter could have added that a lot depends on which mortality statistics you measure anyway. It’s fascinating to see that the body that produced the original mortality figures for Mid Staffs, Dr Foster Intelligence, was later asked to look at a different range of performance indicators, including some more narrowly defined mortality values, and placed Mid Staffordshire ninth best performing hospital in the country – less than a year after the original scandal broke.

Tim Harford also interviewed Richard Lilford who is Profession of Clinical Epidemiology at the University of Birmingham. Lilford suggested a different approach to assessing hospitals: ‘I’ve always felt that we should go for more process-based measurements. What we should look for is whether hospitals are giving the correct treatment.’ Professor Lilford felt this approach had two advantages. The first is that if differences in quality of care can be traced to the processes used, it’s difficult to the right them off as a result of statistical bias. Most important of all, though, if we really want to improve the care provided, ‘we need to improve the hospitals that are in the middle of the range not just those that are at the extreme of the range.’ In fact, he finds that there is more to gain from improving the middle-range of hospitals than from improving the extremes.

In any case, I don’t think I’ve ever come across a good or bad hospital. Some hospitals are strong in certain specialties and weak in others, or have stronger and weaker clinicians, or even clinicians who are good at certain times or at certain things and bad at others. Lilford makes much the same point: ‘the fact of the matter is that hospitals don’t tend to fail uniformly, they’re seldom bad at everything or good at everything. If you go for process you can be specific. You can improve process wherever you find it to be sub-optimal.’

That’s the key. When we understand processes, we can see where problems are arising. There clearly were problems at Mid Staffs. What was needed was careful analysis of what was being done wrong so that it could be fixed, so that processes could be improved. This is the reason for my enthusiasm for analysing heathcare in terms of pathways, spanning whole processes, rather than isolated events.

It’s really good news that the CQC feels that the work at Mid Staffs has produced results.

How much better things might have been if this work of improvement hadn’t had to start in the atmosphere of scandal and panic set going by wild use of mortality figures.

Last word to Professor Lilford.

‘Using mortality as an indication of overall hospital performance is what we would call, in clinical medicine, a very poor diagnostic test. What we’re really interested in when we measure mortality isn’t mortality, it’s not the overall mortality, for this reason: we all will die some day and most of us will do so in hospital. So what we’re really interested in is preventable or avoidable mortality and, because avoidable mortality is a very small proportion of overall mortality, it’s quixotic to look for the preventable mortality in the overall mortality.’

Time we stopped tilting at windmills and took hospital performance a little more seriously.

Tuesday 27 July 2010

Healthcare needs data warehouses. But what for?

The word warehouse conjures up an image of racks of shelving reaching high up towards a roof. Piled high across them are packages, boxes and crates of different sizes and types, reaching into the dim distance in every direction.

As it happens, a data warehouse isn’t that different. Ultimately, it’s a convenient way of storing large quantities of data. The key term here is ‘convenient’.

In one type of data warehouse, convenience is maximised for storage. It’s made as easy as possible to load data and hold it securely. This is the approach taken, in a different field, by major books repositories such as the British Library: as books arrive, they’re simply stored on the next available shelf space with no attempt to try to put them into any kind of order, whether of author or of subject matter. The label that goes on the back of the book simply indicates where in the shelving it’s stored and tells you absolutely nothing about the nature of the book or what’s in it.

Trinity College Dublin
The problem, of course, arises when you want to retrieve the book. It’s fine if it’s exactly where the label suggests it should be. However, if it has been taken out and then incorrectly returned, it may be quite simply impossible to find. A librarian at the British Library told me of a book which had been lost for many years, until someone found it just two shelves away.

This approach is ideal for storage, hopeless for retrieval.

A great many data warehouses, and in particular most of the older ones, are of this type.

The data is securely stored and, as long as you can go straight to it and find exactly the information you want, then it’s fine to hold it that way. However, if you want to do something a little more sophisticated, say you want to start collecting related groups of information, this method is no good at all.

What you need in these circumstances is something less like the British Library and more like a bookshop. There the books are collected first by subject matter, then by author or title. The beauty of this is that as long as you know the structure, you can find not just the particular book you want but also get quickly to other, related books. You wanted a book about travel in Spain – you may well find a whole shelf of them including not just the one you were looking for but perhaps another which is even better.

Of course, when it comes to data you can do far, far more than a bookshop. Because pulling the data together into various collections can be done simultaneously in many different ways. I’m sold on the approach known as dimensional modelling. What this means, from a user point of view, is that a healthcare data warehouse would contain lists of patients, dates, specialties, consultants, diagnoses, in short of anything that can be regarded as a ‘dimension’ or classification of your’. Each of these lists is linked to a set of facts about what was done for any patient at any time.
A fact table at the centre, dimensions linked to it
What this means is that you can quickly ask for all information about care activity carried out in a particular specialty in a particular month, or by a specific consultant for a particular primary diagnosis. And when I say ‘all the activity’ I mean all of it: you don’t have to get hold of inpatient data first and then go back for the outpatients, you’d see the lot from the outset.

That’s a bit like knowing that John Le Carré’s Tinker, Tailor, Soldier, Spy is simultaneously stored under spy novels, under fiction about the cold war, under Le Carré but also under his real name of David Cornwell, under books published in 1974, and under any other category that some user might find interesting. And, because we’re talking about computer technology, it’s under all those categories although there’s actually only one copy of the book in the bookshop.

Now that’s a warehouse structure designed to optimise retrieval rather than storage, and therefore to make reporting particularly easy. That’s why this second more modern approach to structure is so much more to be preferred than the older one.

But then there’s one other aspect of data warehouses which makes them particularly powerful, whether they’re of the older or the newer type.

They can include rules engines which manipulate the data.

If the incoming data is of poor quality, rules can tell you so: in the bookshop example, you’d get an alert saying ‘the author’s name is illegible’, ‘the date of publication isn’t given’ so that you can get the classification information improved.

If you need to add new information derived from the incoming data, rules can do that too: if you know that data from one department in the hospital shows the consultant identifier as a code, say ‘MKRS’ and you want it to be stored as ‘Mr Mark Smith’, you can define a rule that adds the form you want. In the bookshop example, it could add ‘David Cornwell’ to John le Carré’s name.

Taken together, these aspects of data warehouses – structures optimised for reporting and the application of well-defined rules – make them absolutely essential tools for understanding healthcare activity. They can take raw data and turn them into management information. With the difficult management decisions that lie ahead, that’s more crucial than ever before.

Thursday 22 July 2010

Finding the right pathway to understand healthcare

One of the most important ways in which Mental Health can become a model for healthcare generally is in promoting the pathway approach to care delivery.

Because acute care is generally delivered over a short time, when we think about it we tend to focus on what is happening at a particular moment. Mental Health, on the other hand, deals with treatments that last a long time and which need to be seen in a different way.

Even a clear example of short-stay care, say an operation performed as a day case, may require an attendance beforehand for tests and perhaps a follow-up outpatient appointment afterwards. The care is provided by a pathway embracing all three.

And then there are those conditions that have to extend over longer periods. Cancer treatment may involve courses of chemotherapy and radiotherapy, with perhaps surgery as well. There are many other conditions for which this is true: diabetes, asthma, obesity, coronary heart disease, and the list keeps growing. The complication for many of these is that the pathway isn’t even limited to hospital setting alone: much of the care may be provided by GPs or by community hospitals.

This leads to many challenges for information services.

Even within a single hospital, we need to find ways of linking data about emergency attendances, outpatient appointments and inpatient stays. Having made the links, we need to apply logical rules to break some of them again: the patient who had a coronary in June may be the same as the one who was treated for cholecystitis in September, but there are two pathways here that need to be distinguished.

It’s also only a first step to link data about attendances and admissions. We also need to pull in departmental data: records about medication, diagnostic tests, therapy services, and so on, all need to be associated with the corresponding events.

And not just with the events – they also need to be associated with the whole pathway. From one point of view, it may well be interesting to know that the Full Blood Count was carried out following a particular outpatient attendance, especially if the protocol requires that it be carried out then. On other pathways, however, we just need to know that the test was done, without specifying when on the pathway it happened. So we need links to events and to pathways.

All this requires relatively complex processing. It’s made far worse if the data is poor or incomplete – say the patient identification data is only partial on some of these records. That can be a major challenge. It seems to me, though, that the only way to solve the problem is to start working with the data: when staff see that the analysis is happening, they’ll have a massive incentive to get the data right.

The rewards are extraordinary. This kind of analysis allows hospitals to start applying protocols of care, because they will have the means to check whether they’re being respected or not. My guess is that they’ll be astonished by the results. So far, I’ve only worked with some limited sample data, but I’ve been amazed by the variation in care pathways it reveals – for example, even simple conditions requiring day surgery may involve one, two or even three inpatient stays.

One particular case springs to mind, of a patient who had a Caesarean preceded by no less than six outpatient attendances. The data quality for her was however good: difficulties with labour had been recorded as a diagnosis. Suddenly the data came to life. We weren’t just looking at a bunch of entries from a PAS, but at a real live case of a woman with a real problem, and a hospital that was working to help her deal with it.

It was the pathway view that revealed the real nature of that story.